
This year the logging framework got a bit of an update. The most notable is definitely the ability to add signposts throughout your code with the new os_signpost functions. Signposts are a great tool to measure the performance of your code and in this article we’ll set up signposts and show how to use them.
Signposts
Sooner or later you’ll find yourself trying to figure out where is that bottleneck in your app. There are many tools available to you in Instruments to help you do this, but with os_signposts you can make your life a lot easier. And finding those performance issues has never been faster.
With iOS 12 the logging API got a boost with some new functions. One of them is the os_signpost function. os_signpost is pretty straight forward to use. You mark the beginning of your signpost (read: operation) and the end. And you let the Instruments do the rest. With os_signpost you have a simple visual representation of how long your operations take. All you have to do is sprinkle some functions in your existing code base and everyone can fire up the Instruments and start profiling your app.
Without further ado, let’s jump into some code…
The Code
We’ll be profiling a simple app I found lying around in my repo 🙂 The app connects to unsplash.com and searches for some images. It will display those images in a tableview. When you tap on an image it will download a full resolution image and save it to your photo album. You can find the complete project in the GitLab repo. Don’t forget to go to unsplash.com and register for an API key.
There are two things that we’ll be using. Signposts and points of interest. To keep things simple, we’ll keep our custom log objects as instance variables in our view controller. Depending on your architecture you will probably keep these logs somewhere else. Here are our two logs:
Note how the ‘poiLog’ is using the built-in category ‘.pointsOfInterest’. This will allow us to use a special instrument. More on that later.
Signposts
Some of the operations that we’ll be profiling are search operations and image loading operations. This is our search operation with the signposts:
After defining the signpost id we call our os_signpost function to signal the beginning of our operation. Notice how we passed some contextual data as the last parameter of the function. This will come in handy later when we start profiling. When our operation is finished, we have to ‘close’ our signpost by calling the same function with the ‘.end’ parameter. Instruments will use the ‘.begin’ and ‘.end’ pair of signposts to draw a nice little graph for us.
Here’s another example of setting up signposts. This one is for the image loading operation:
As you can see, setting up signposts is pretty simple.
Points of Interest
There’s another special kind of signpost called points of interest. It’s nothing more than a simple event that we log to a logger with a special category of ‘.pointsOfInterest’. You don’t need to ‘open’ and ‘close’ these signposts, they are just simple events that will be displayed differently on your graph in Instruments.
This is an example of one of those events.
Mix it up
You can easily mix the two types up and use them throughout the code. In this next snippet we’re using a point of interest in the middle of our standard signpost:
OK, enough of the code. It’s time to see how all this looks like in Instruments. Select ‘Product > Profile’ from the menu in Xcode…
Profiling
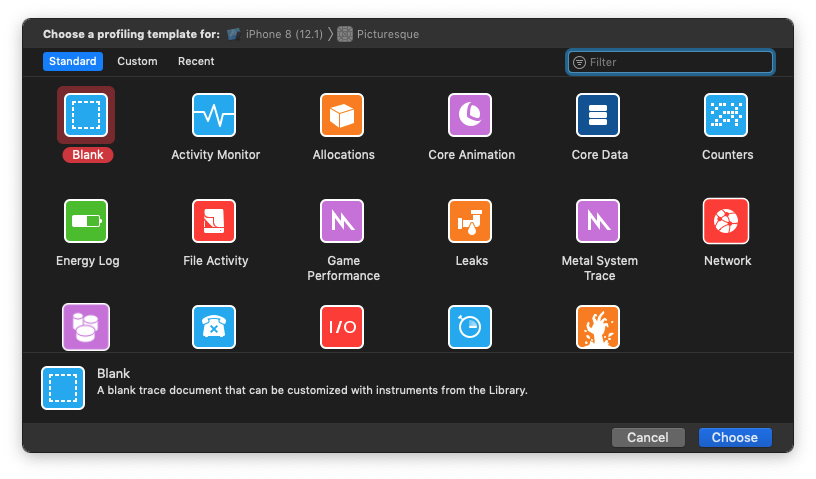
If you didn’t start your Instruments, do so by selecting cmd+I from Xcode. Select the blank template from the list:
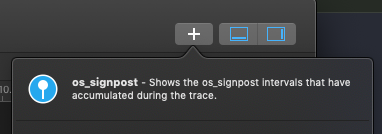
Now you’ll add two instruments from the library. One of them is called ‘os_signpost’:
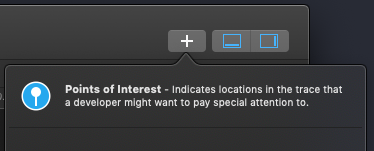
And the other one is called ‘Points of Interest’:
Drag&Drop both of them to your instruments main window. Now, simply press the red record button and start using your app. Scroll to the bottom to trigger the prefetch, search for some photos, tap on some of them to save them to your photos album. As you’re doing all these operations, you’ll notice that your instruments is updating with graphs and events.
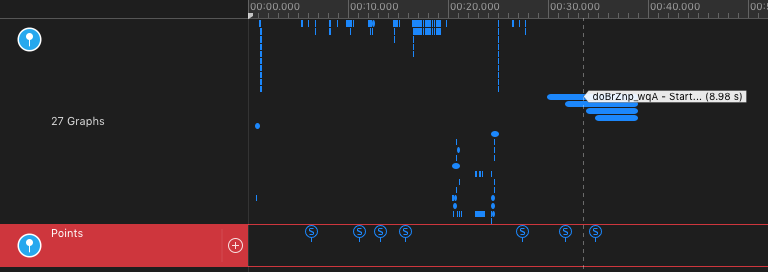
Your instruments could look something like this:
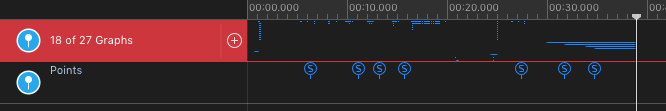
If you increase the height of the ‘os_signpost’ instrument and hover above one of the lines, you will see that it’s actually an image we’re trying to save. The lines in this instrument are the signposts that we’ve added in our code. The beginning of the line is the ‘.begin’ function call and the end fo the line is the ‘.end’ call. Pretty simple and pretty useful 🙂
In the lower half of your Instruments window you can see a lot more details about your signposts. You can drill down and inspect them all:
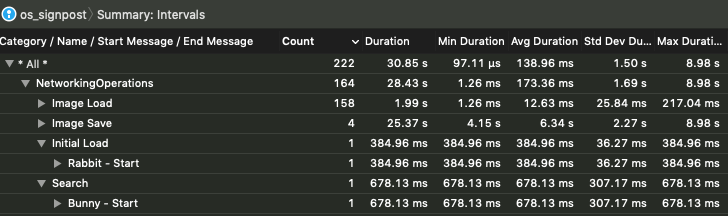
You can immediately see that all our ‘Image Save’ operations took a total of about 25 seconds. The search for bunny took about 0.7 seconds.
One last thing to cover are the points of interest. It’s the simpler of the two instruments. As you can see on the graph, every call to the function simply added a point to the ‘Points’ instrument graph:
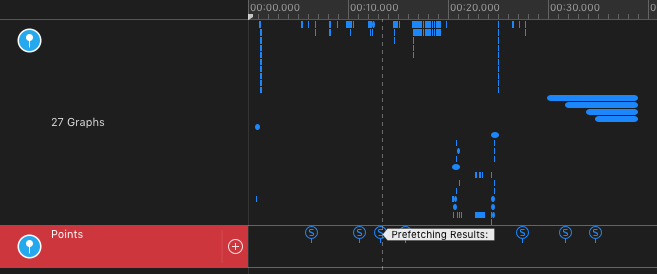
Hovering above the point will give you the name. And just like the signpost, you can inspect the details in the lower pane:
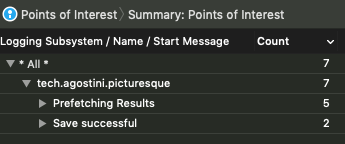
Make sure you select ‘Summary: Points of Interest’ to see this graph. This is a great way to simply count how many times your event occurred.
Performance Tips
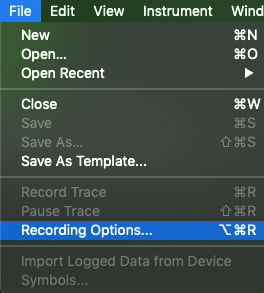
By default, the Instruments will start in the ‘immediate’ mode. This means that the Instruments will collect data from your app as soon as it’s available. Sometimes you’re only interested in the last couple of seconds of your app runtime. This will greatly improve the performance and memory impact of Instruments. Go to ‘File > Recording Options’:
And change the recording mode to record the last x seconds:
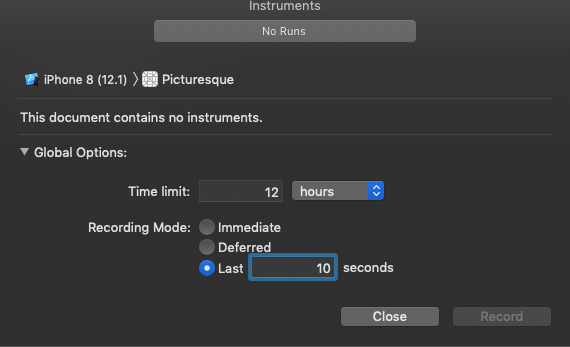
You can also select the ‘Deferred’ mode which is more performant than the ‘Immediate’ mode.
Conclusion
We’ve got a great new tool in our debugging toolbox this year and with very little effort you can do wonders with it. It’s very simple to use and it will definitely help you find performance issues with your app.
This is a great addition to the already fantastic new logging framework from Apple. And I will welcome any help that I can get when debugging apps 🙂
You can find the demo project on GitLab as well as all the code snippets from this article. I hope you’ve learned something new today and that you had some fun 🙂
Have a nice day 🙂
~D;