 Almost every project that you’ll work on will have some bugs in it. On some legacy apps you might even spend most of your time debugging. In this article we’ll cover some debugging tips&tricks to help you out with your debugging adventures and save you some time.
Debugging Tab
When you hit a breakpoint or your app crashes, Xcode will jump to the line that caused the execution to pause. A lot of times this can be inconvenient. You probably have some tabs open, and then suddenly one of your tabs is no longer showing the file you had opened. You could easily navigate back to the file you had originally opened, but you don’t have to. Xcode can automatically open a debug tab every time your app pauses execution. This will keep all your existing tabs intact, and you can focus on debugging your app without worrying about what file you had opened, or opening a new debugging tab yourself.
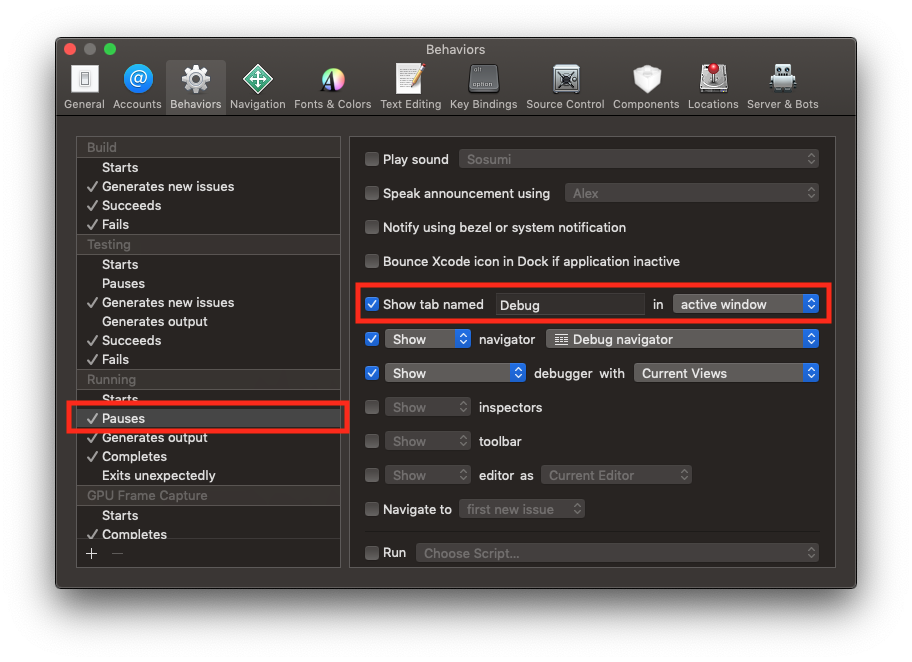
To open a debugging tab automatically, simply go to your Xcode preferences and the ‘Behaviors’ tab, select the ‘Pauses’ under the ‘Running’ section. In this window you simply have to select the ‘Show tab named’ option. Check out the screenshot for reference:
Change Variables in Runtime
We use brakpoints all the time. And sometimes you want your variables to be a certain value so you can test an edge case, or satisfy a certain branching condition in order to test your code and hunt down your bug. Of course, you could simply hard code your values, but there’s a better way. You can use the lldb ‘expression’ command to evaluate expressions in runtime. In our case we’ll use this command to assign a value to a variable.
Let’s say we have a simple function:
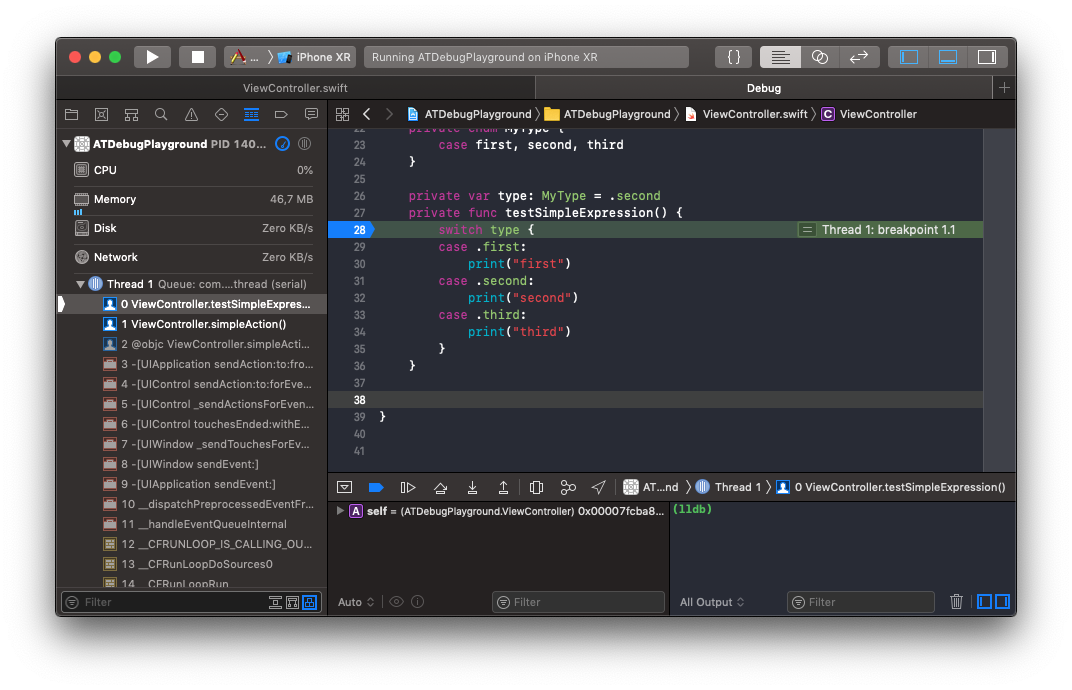
If we set a breakpoint right on the switch command, we could change a value of the variable ‘type’ to any valid value we want when that breakpoint hits.
All we have to do is type the command in the console:
And if you continue execution the console will print out ‘third’.
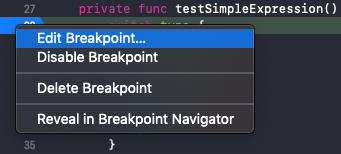
We can do even better than that. Let’s say we want our code to constantly behave like the ‘type’ variable has a value of ‘.third’. We can create an auto continuing breakpoint. Right click on your breakpoint and select ‘Edit Breakpoint…’:
Select the ‘Add Action’ button:
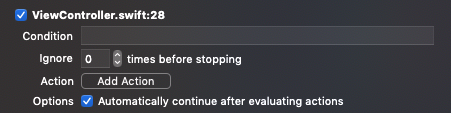
And type in the same command you typed in the console previously:
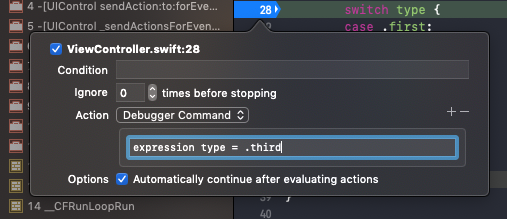
Most importantly, make sure that the ‘Automatically continue…’ option is selected. Now when you hit your breakpoint the expression will get evaluated and the execution will continue. You essentially injected the code into your app without recompiling it. How cool is that 🙂
Call Functions in Runtime
Much like changing the variables in runtime, you can call functions as well. You can pretty much execute any code. Let’s say you have a simple function that is calling some other function:
You can set a breakpoint at the print statement and add a new action that will call the function:
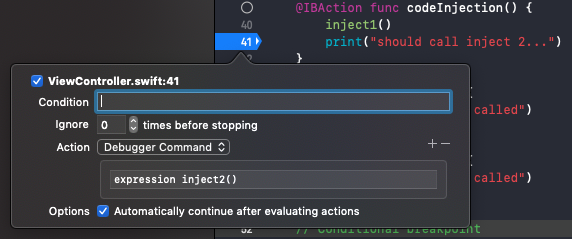
Now, when you hit this breakpoint the function ‘inject2’ will get executed just before the print statement.
Conditional Breakpoints
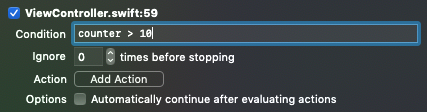
Sometimes you just don’t want your breakpoint to hit every time. You can easily set a condition on your breakpoint. Let’s say you have a piece of code like this:
If you set a breakpoint at the print statement and you want to hit it when the counter value is greater than 10. You can simply edit the breakpoint and add the condition:
Pretty simple, right 🙂
Ignore Breakpoints
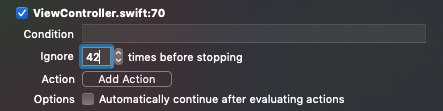
You were probably in a situation where you had your breakpoint set and you knew that the first x hits are not important. It’s real easy to ignore a breakpoint for n times before it hits. Let’s take this code, for example:
If you set a breakpoint at the print statement, it would hit every time. If you know that your bug is happening after the 42nd iteration, you can simply edit your breakpoint and ignore it for 42 iterations. Take a look at the screenshot:
To be honest, you probably knew about this one already 🙂
Replace Code in Runtime
By this point you know how to inject code during execution using breakpoints without recompiling your project. But, did you know that you can replace code as well. To be specific, you’re not replacing code, you’re intercepting a function call and calling another function. But, essentially, you’re replacing that one line of code with another.
Every time you hit a breakpoint the line where the execution pauses will get highlighted. Take a closer look at it:
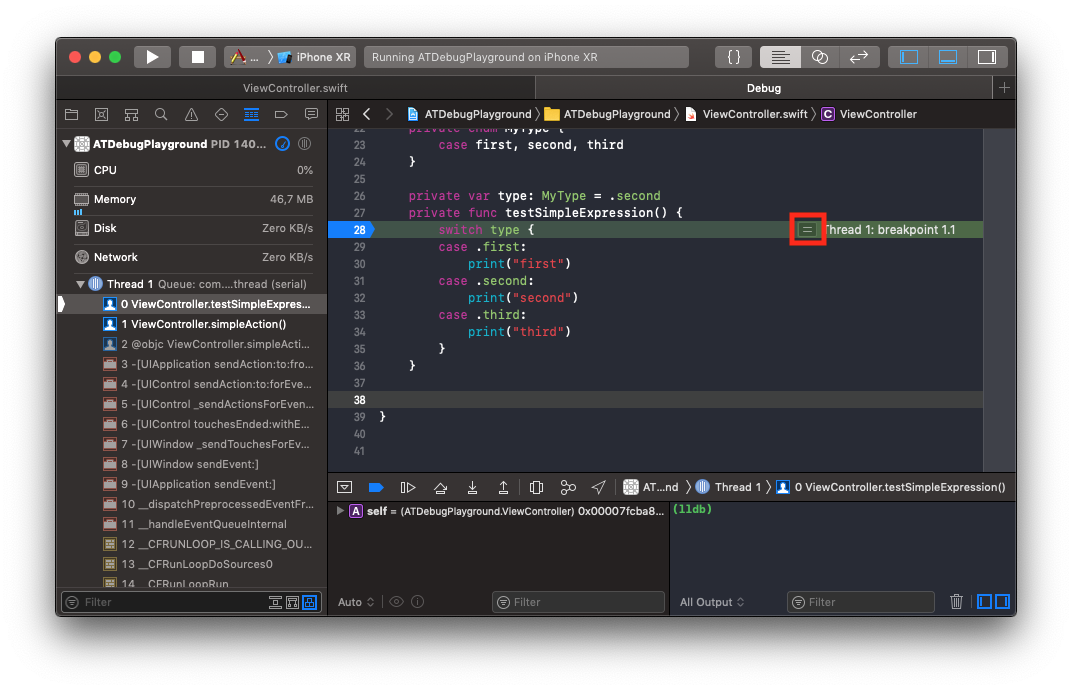
This is the instruction pointer. And it tells us which line of code will execute next. You can actually drag the little handle and move your instruction pointer to where ever you want. When you continue execution that line will execute next. Now, you can imagine, this is extremely dangerous to use. Don’t go moving your instruction pointer around for fun, because you’ll put your app in an inconsistent state 🙂 We’ll use this powerful feature to intercept our function call and modify it a bit.
Let’s say we have this code:
And instead of calling ‘someFunction(param: 99)’ we want to call the same function with a different argument value. Let’s say you want to call ‘someFunction(param: 42)’. We can move the instruction pointer over the original function and inject a new function call:
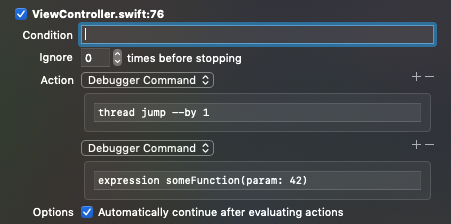
In this example we’re using two actions. You can use the ‘+’ symbol to add the second debugger command. In this example we’ve replaced a call to one function with a call to another function. We used the same function with different arguments in our example, but you can easily call any other function that you wish.
Watchpoints
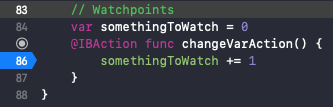
Sometimes you just want to know when a value of a variable changes, and you want to hit a breakpoint then. Fortunately, this is simple to do. Set your breakpoint somewhere in your function, in order to pause execution:
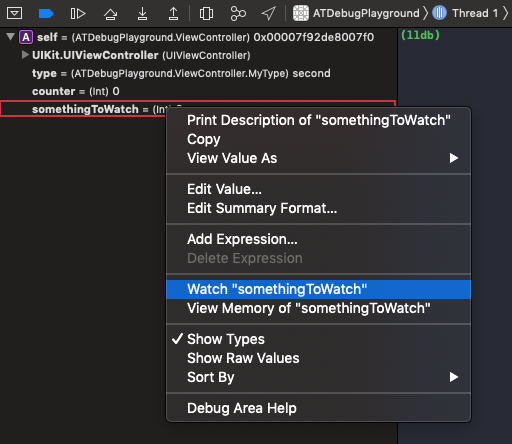
When the execution pauses, in your variables view find the variable you want to watch, right-click on it and select ‘Watch…’:
Now, in your breakpoint navigator, you will see a new breakpoint at the bottom:
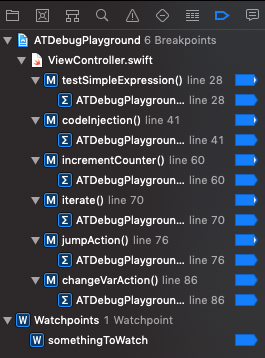
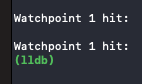
You’re watching your variable for changes. Every time it get’s changed, the execution of your app will pause on the line that is currently changing the variable:
Conclusion
These are just a few tips and tricks that might help you out in your debugging adventures. If any of them can save you even a bit of time, that would make me very happy 🙂
If you want to dig a bit deeper into this subject, there’s a great WWDC video that is covering this subject in more detail, check it out. You can find all the code from this post in the GitLab repo.
As usual, have a nice day 🙂
~D;