Memory Graph Debugging in Xcode
Dejan Agostini

We don't have a garbage collector in swift, so we need to understand the memory graph of our apps. If we're not careful with object references we can easily create strong reference cycles and leak memory. Sooner of later, you'll find yourself hunting down that illusive memory leak. Fortunately, we have some tools that can help us with that. In this article we'll get you started with memory graph debugging and show you some of the cool features of this great tool.
The Code
Let's create a strong reference cycle for ourselves. We'll have a simple controller class that looks like this:protocol MyControllerDelegate {
func someCallback()
}
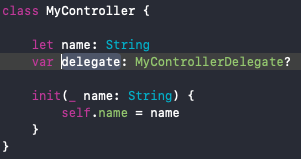
class MyController {
let name: String
var delegate: MyControllerDelegate?
init(_ name: String) {
self.name = name
}
}
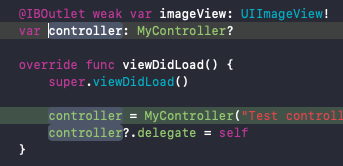
And the controller will be used from our view controller, like so:
override func viewDidLoad() {
    super.viewDidLoad()

    controller = MyController("Test controller")
    controller?.delegate = self
}
Of course, the problem is obvious :) We'll keep the problem obvious so that we can focus on using the tool to detect this leak. You can checkout the demo project from GitLab and run it.
 If you select 'Memory' you'll see the detailed memory graph on the right:
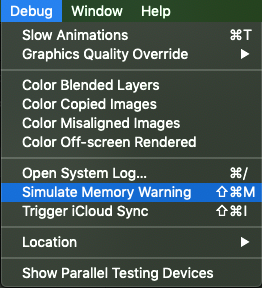
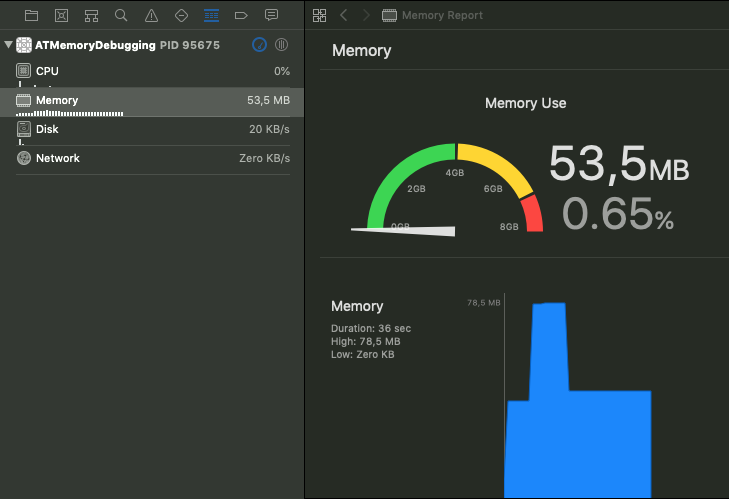
 Our memory spiked and it's not dropping. We're using a large image for our demo so we need to make sure that iOS is not caching it. What we'll do next is simulate a memory warning. You can find the option to do this in the debug menu of your simulator:
 After simulating the memory warning our memory footprint is the same. So we have ourselves a memory leak.
 'Malloc Stack' will give you the stack trace for your memory leak. That's a very useful feature that will help you identify the cause of the leak. 'Malloc Scribble' will help Xcode give you more accurate results by filling freed memory with a predefined value, so it will be more obvious which memory blocks are not being released. You can find more info on malloc stack and scribble in the official documentation.
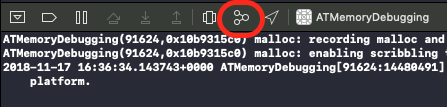
Now we can debug the memory graph by pressing the button in the debug area:
'Malloc Stack' will give you the stack trace for your memory leak. That's a very useful feature that will help you identify the cause of the leak. 'Malloc Scribble' will help Xcode give you more accurate results by filling freed memory with a predefined value, so it will be more obvious which memory blocks are not being released. You can find more info on malloc stack and scribble in the official documentation.
Now we can debug the memory graph by pressing the button in the debug area:
 Build and run the app, push the second view controller a few times, to reproduce the leak. And then press the button. When Xcode displays the memory graph it will pause the execution of your app. Imagine if it didn't :)
You'll be presented with the memory graph of the app:
Build and run the app, push the second view controller a few times, to reproduce the leak. And then press the button. When Xcode displays the memory graph it will pause the execution of your app. Imagine if it didn't :)
You'll be presented with the memory graph of the app:
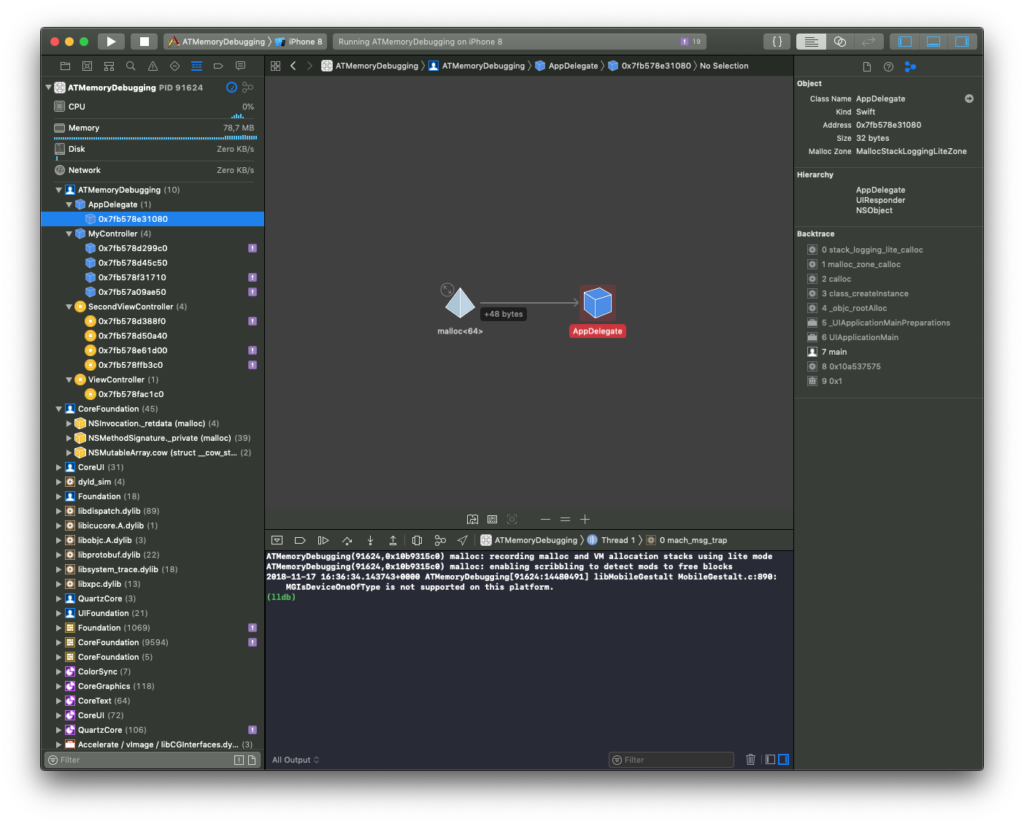 The initial screen looks pretty simple. What we care about is the left pane and those purple exclamation marks. What you want to look for are objects that you've created that shouldn't be there. We can se immediately that we have four instances of 'SecondViewController' and four instances of 'MyController' when in fact there should only be one.
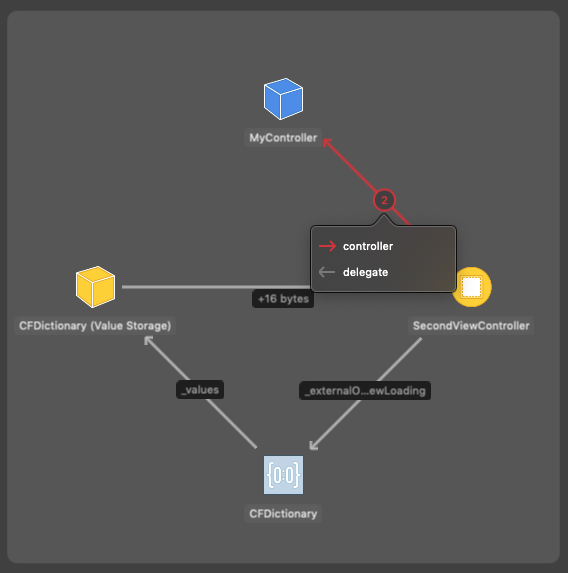
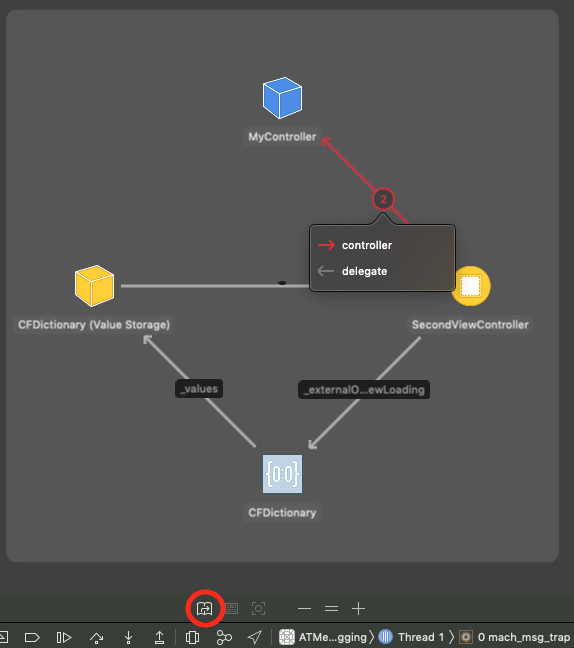
 You can see immediately from this graph that 'MyController' and 'SecondViewController' are referencing each other. The link has a little number '2' on it. If you click on the link you will actually see the names of the properties in each of the two controllers that are referencing each other:
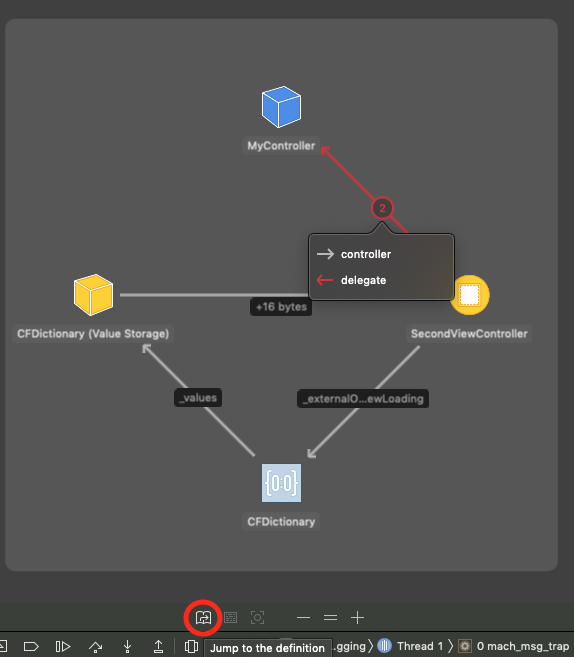
 When you click on it, you will see a button 'Jump to definition' being enabled:
 This will lead you to the source file where that property is defined:
 If you want to see where your 'delegate' is being defined, you just have to select it on the memory graph and jump to its definition:
 Here's the definition:
 After inspecting both of the references, we see that both of them are strong. Of course, one of them has to be weak. We are using a delegate pattern here, so we know that a common practice is to make your delegates weak so we'll do that. Your applications will be different. You might not be using this common pattern, so it'll be up to you to decide which reference should be a weak reference.
Let's change our reference:
After inspecting both of the references, we see that both of them are strong. Of course, one of them has to be weak. We are using a delegate pattern here, so we know that a common practice is to make your delegates weak so we'll do that. Your applications will be different. You might not be using this common pattern, so it'll be up to you to decide which reference should be a weak reference.
Let's change our reference:
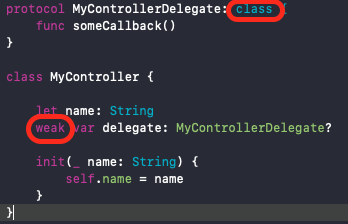 Notice how we had to bound our protocol to a class type.
 There will be a little arrow on the right side of the selected row. Clicking on it will lead you to the file where the selected object is being created. Our example is a simple one, so we don't have to use the stack trace. I'm sure you know what a stack trace is and how to use it, so I won't bother you with the details here :)
 Just to make sure. Open the memory graph debugger and make sure that your objects are not allocated:
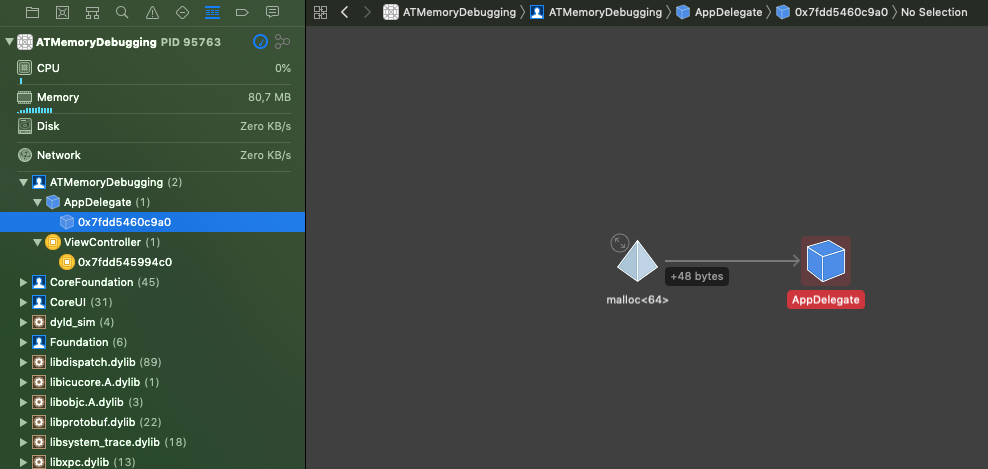 Perfect, that's exactly what we expect to see. And no purple exclamation marks :)
 And simply double click the file to open it in Xcode.
In our example we've used a 'UIImageView' in the 'SecondViewController'. We loaded an image that was in our assets. So these dictionaries actually contain our image. Now you're wondering why a dictionary and not a UIImage...
If you pay attention to when you load the 'SecondViewController' multiple times the memory footprint won't increase that much more. The memory is not increasing because the image is cached by the system and it's being saved in a dictionary (I would have assumed it would be the NSCache, I guess it's not :) ).
So when you first load the 'SecondViewController' the image will be loaded in the memory and every subsequent push of the same view controller to the navigation stack will load the same image from cache and it will only add a few kB of memory to the overall memory footprint. That's why the memory was released when you simulated the memory warning. iOS was simply emptying the cache.
And simply double click the file to open it in Xcode.
In our example we've used a 'UIImageView' in the 'SecondViewController'. We loaded an image that was in our assets. So these dictionaries actually contain our image. Now you're wondering why a dictionary and not a UIImage...
If you pay attention to when you load the 'SecondViewController' multiple times the memory footprint won't increase that much more. The memory is not increasing because the image is cached by the system and it's being saved in a dictionary (I would have assumed it would be the NSCache, I guess it's not :) ).
So when you first load the 'SecondViewController' the image will be loaded in the memory and every subsequent push of the same view controller to the navigation stack will load the same image from cache and it will only add a few kB of memory to the overall memory footprint. That's why the memory was released when you simulated the memory warning. iOS was simply emptying the cache.
The Leak
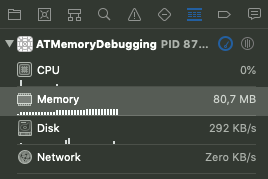
Build and run the app. Push the second view controller and go back. Do this a few times. Select the debug navigator in Xcode:
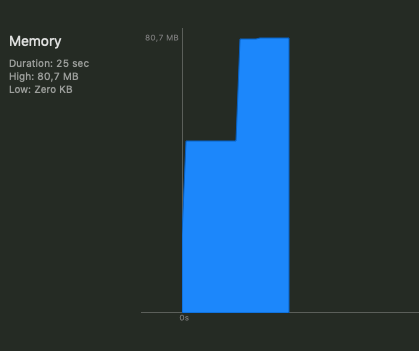
If you select 'Memory' you'll see the detailed memory graph on the right:
Our memory spiked and it's not dropping. We're using a large image for our demo so we need to make sure that iOS is not caching it. What we'll do next is simulate a memory warning. You can find the option to do this in the debug menu of your simulator:
After simulating the memory warning our memory footprint is the same. So we have ourselves a memory leak.
Memory Graph Debugging
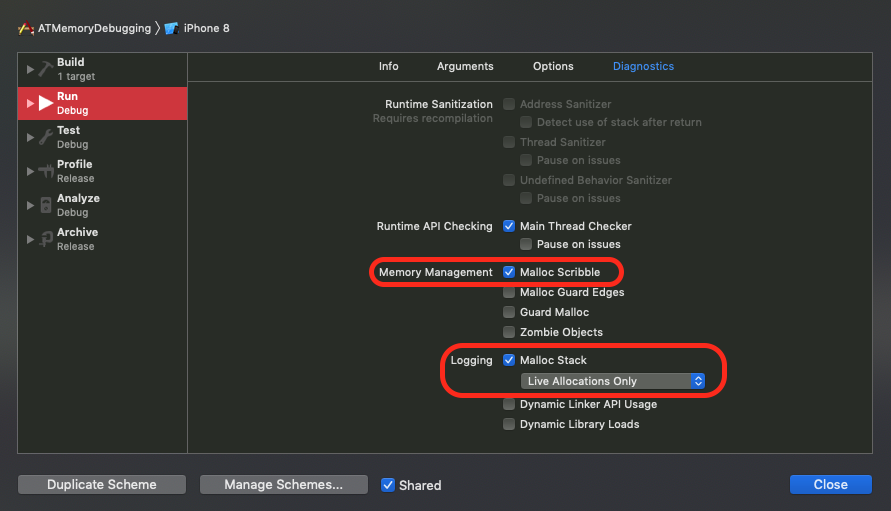
You could just go in and display your memory graph. It would show you the leak. Before you do that, go to the schema editor instead and make sure to enable the 'Malloc Stack' for live allocations only and 'Malloc Scribble':
'Malloc Stack' will give you the stack trace for your memory leak. That's a very useful feature that will help you identify the cause of the leak. 'Malloc Scribble' will help Xcode give you more accurate results by filling freed memory with a predefined value, so it will be more obvious which memory blocks are not being released. You can find more info on malloc stack and scribble in the official documentation.
Now we can debug the memory graph by pressing the button in the debug area:
Build and run the app, push the second view controller a few times, to reproduce the leak. And then press the button. When Xcode displays the memory graph it will pause the execution of your app. Imagine if it didn't :)
You'll be presented with the memory graph of the app:
The initial screen looks pretty simple. What we care about is the left pane and those purple exclamation marks. What you want to look for are objects that you've created that shouldn't be there. We can se immediately that we have four instances of 'SecondViewController' and four instances of 'MyController' when in fact there should only be one.
References
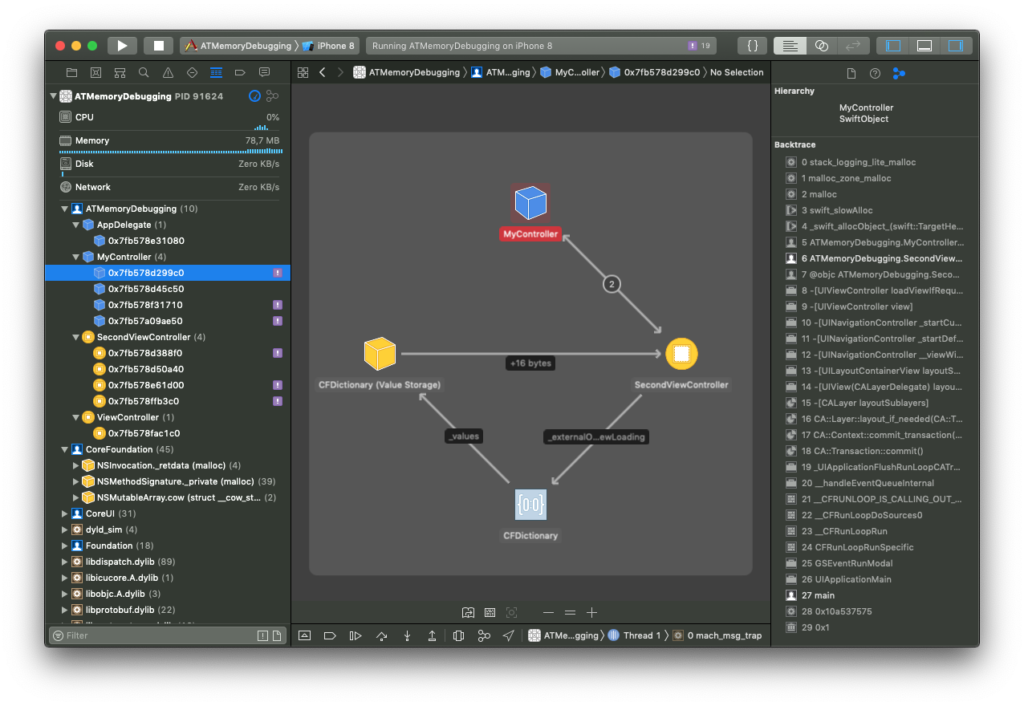
Select the first instance of 'MyController' and your graph will change into the 'leaks' view:
You can see immediately from this graph that 'MyController' and 'SecondViewController' are referencing each other. The link has a little number '2' on it. If you click on the link you will actually see the names of the properties in each of the two controllers that are referencing each other:
When you click on it, you will see a button 'Jump to definition' being enabled:
This will lead you to the source file where that property is defined:
If you want to see where your 'delegate' is being defined, you just have to select it on the memory graph and jump to its definition:
Here's the definition:
After inspecting both of the references, we see that both of them are strong. Of course, one of them has to be weak. We are using a delegate pattern here, so we know that a common practice is to make your delegates weak so we'll do that. Your applications will be different. You might not be using this common pattern, so it'll be up to you to decide which reference should be a weak reference.
Let's change our reference:
Notice how we had to bound our protocol to a class type.
The Stack
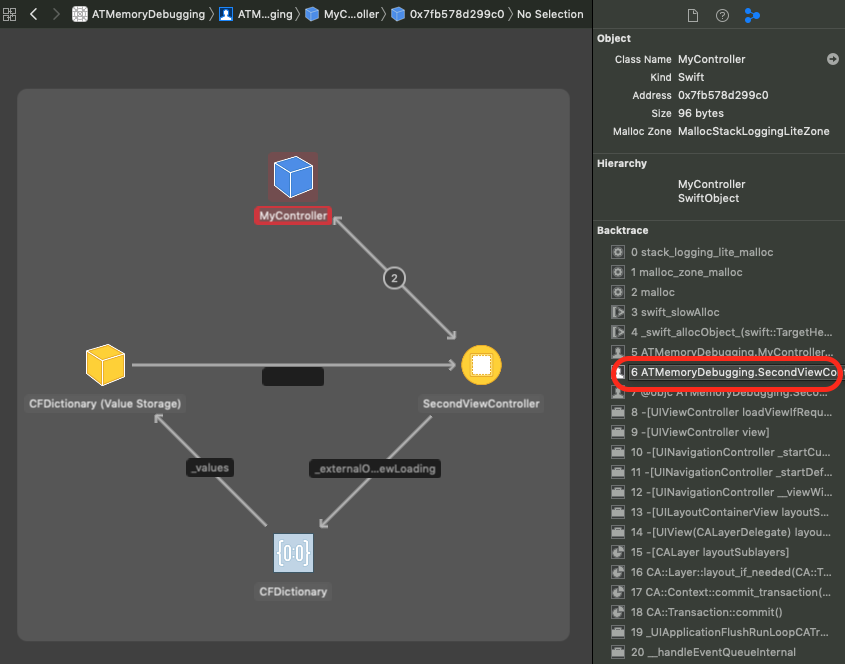
Before we test our fix... We enabled the 'Malloc Stack' before we started debugging. If you want to inspect your stack, you can see it on the right:
There will be a little arrow on the right side of the selected row. Clicking on it will lead you to the file where the selected object is being created. Our example is a simple one, so we don't have to use the stack trace. I'm sure you know what a stack trace is and how to use it, so I won't bother you with the details here :)
Testing The Fix
Just build and run the app. Push the second view controller a few times. Check out the memory report, you should see that the usage went up. But, if we trigger a memory warning in our simulator, the memory is reclaimed by the system:
Just to make sure. Open the memory graph debugger and make sure that your objects are not allocated:
Perfect, that's exactly what we expect to see. And no purple exclamation marks :)
Save It For Later
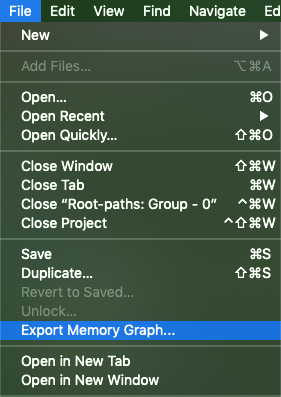
One nice little feature is that you can export your memory graph and analyse it later. Or you can send it so someone else in your team to look it over. You can export your graph from the 'File' menu:
And simply double click the file to open it in Xcode.
A Side Note
Feel free to skip this section if you want, we won't talk about the memory graph debugging in it... In the 'leaks' graph we've recognised our two classes. But what are those other classes, you might wonder?
In our example we've used a 'UIImageView' in the 'SecondViewController'. We loaded an image that was in our assets. So these dictionaries actually contain our image. Now you're wondering why a dictionary and not a UIImage...
If you pay attention to when you load the 'SecondViewController' multiple times the memory footprint won't increase that much more. The memory is not increasing because the image is cached by the system and it's being saved in a dictionary (I would have assumed it would be the NSCache, I guess it's not :) ).
So when you first load the 'SecondViewController' the image will be loaded in the memory and every subsequent push of the same view controller to the navigation stack will load the same image from cache and it will only add a few kB of memory to the overall memory footprint. That's why the memory was released when you simulated the memory warning. iOS was simply emptying the cache.